Every lot you hold. Every trade you closed.
Net Worth Nexus reads the tax lots your linked brokerages report and shows which are trading above what you paid, how long your money has been held against the one-year line, and which lots turn long-term next. It also records the realized gain or loss on every trade you close, matched first in, first out, and charts it over time.
The share of your lots in gain.
The Tax lens opens on one reading: the share of your tax lots trading above what you paid. It counts lots, not dollars, so a small winner weighs the same as a large one.
Beside it is the holding period, weighted by value and drawn against the one-year line, the point after which a sale at a gain is taxed at long-term rates. It shows what you hold on each side of that line and how many lots sit below cost.
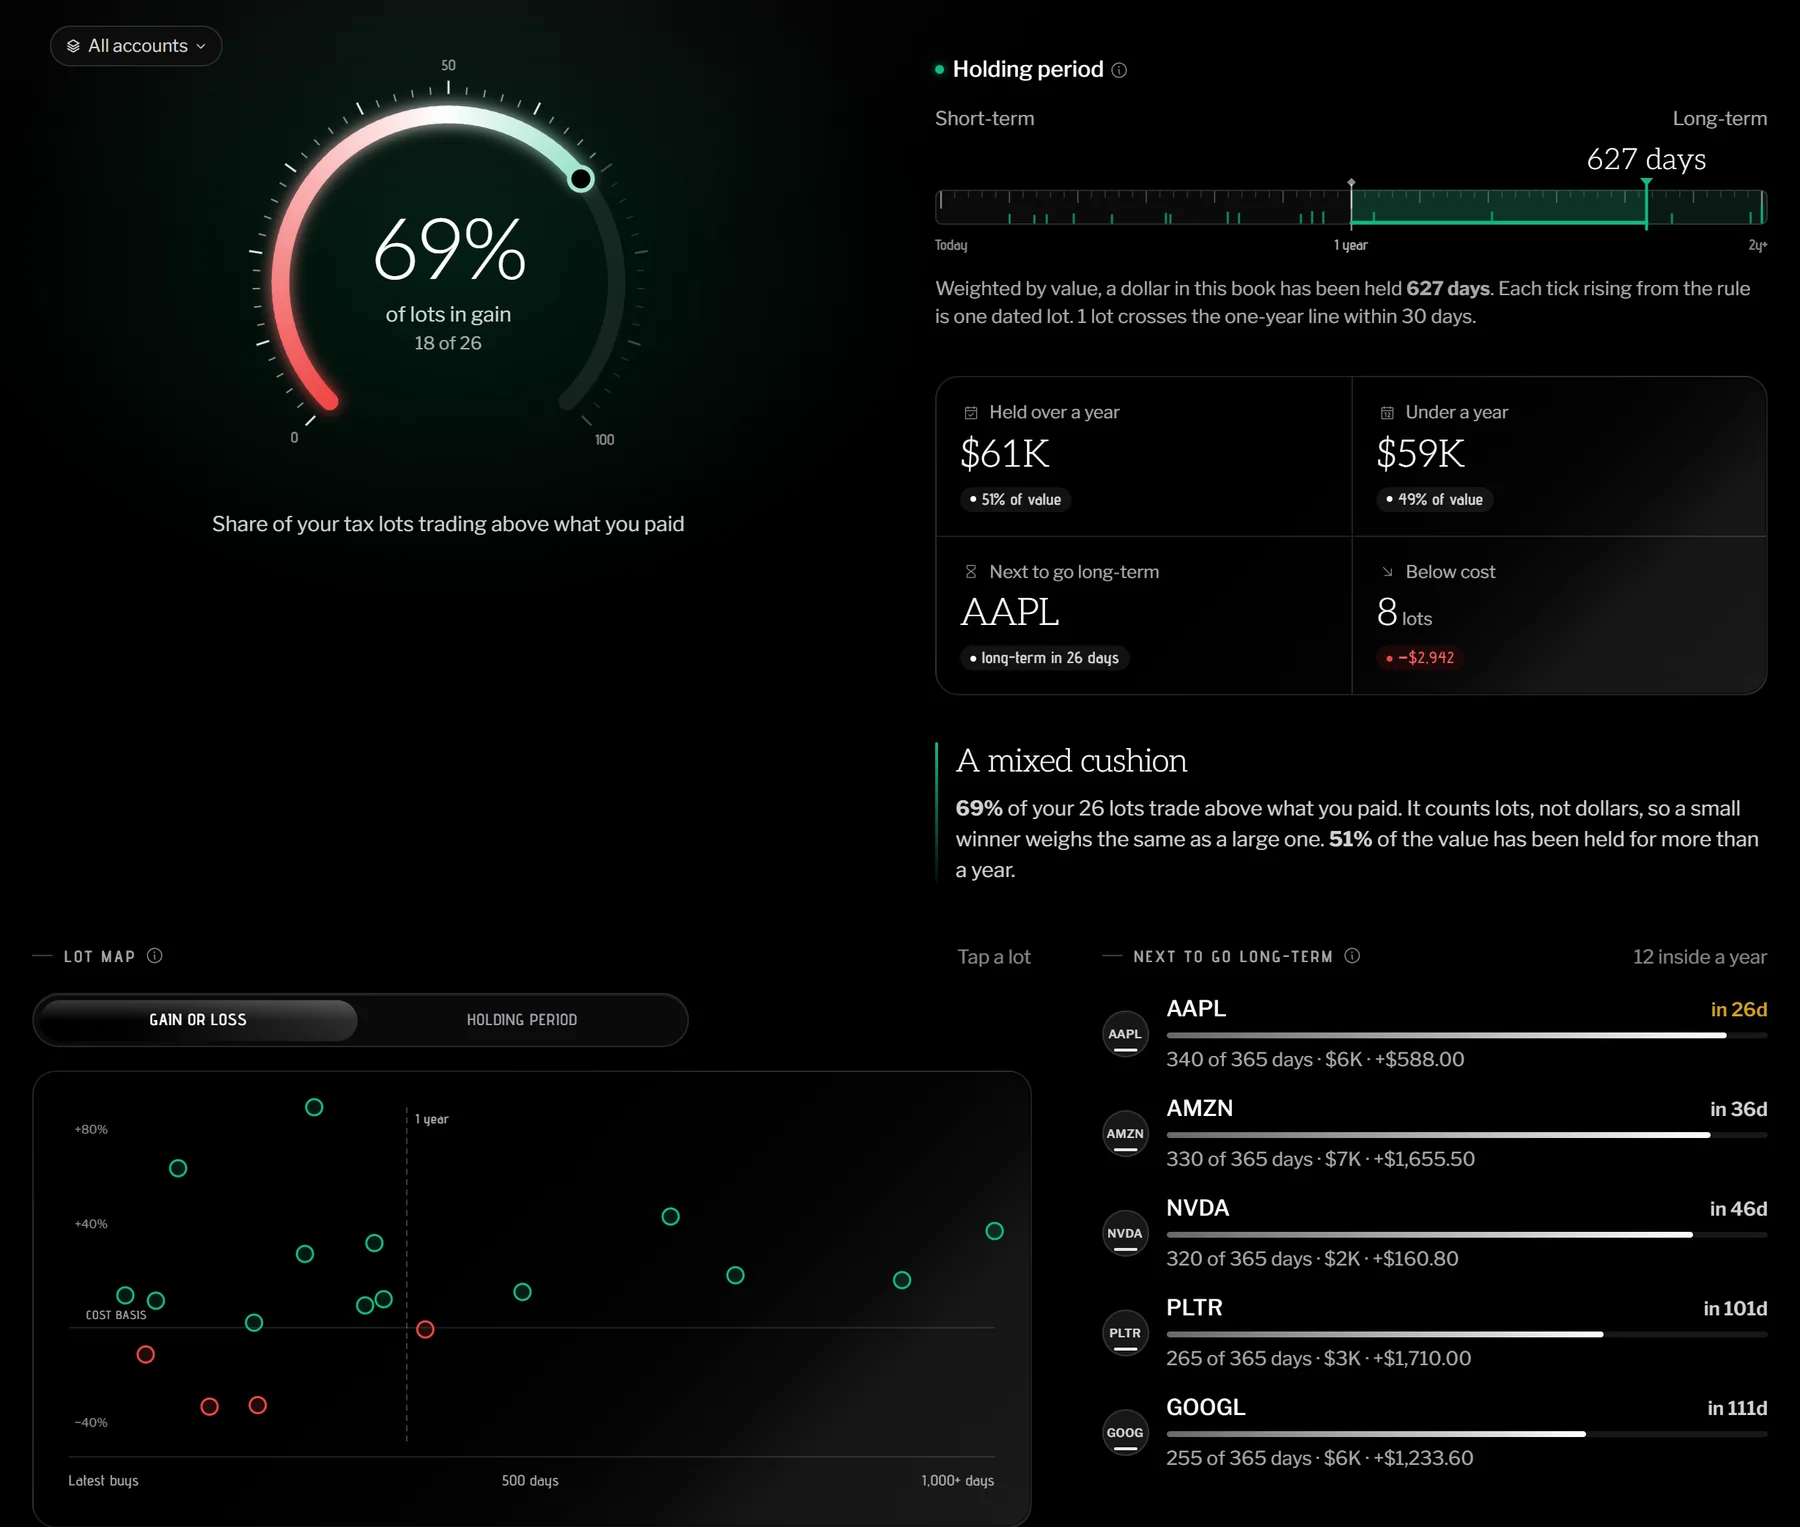
The lots that turn long-term next.
A lot map plots every dated lot by its gain or loss and how long it has been held. Beside it, the lots still inside a year count down, each with the days it has left and what it is up or down.
When a brokerage reports no purchase dates, holding periods cannot be measured, and the lens says so instead of guessing.
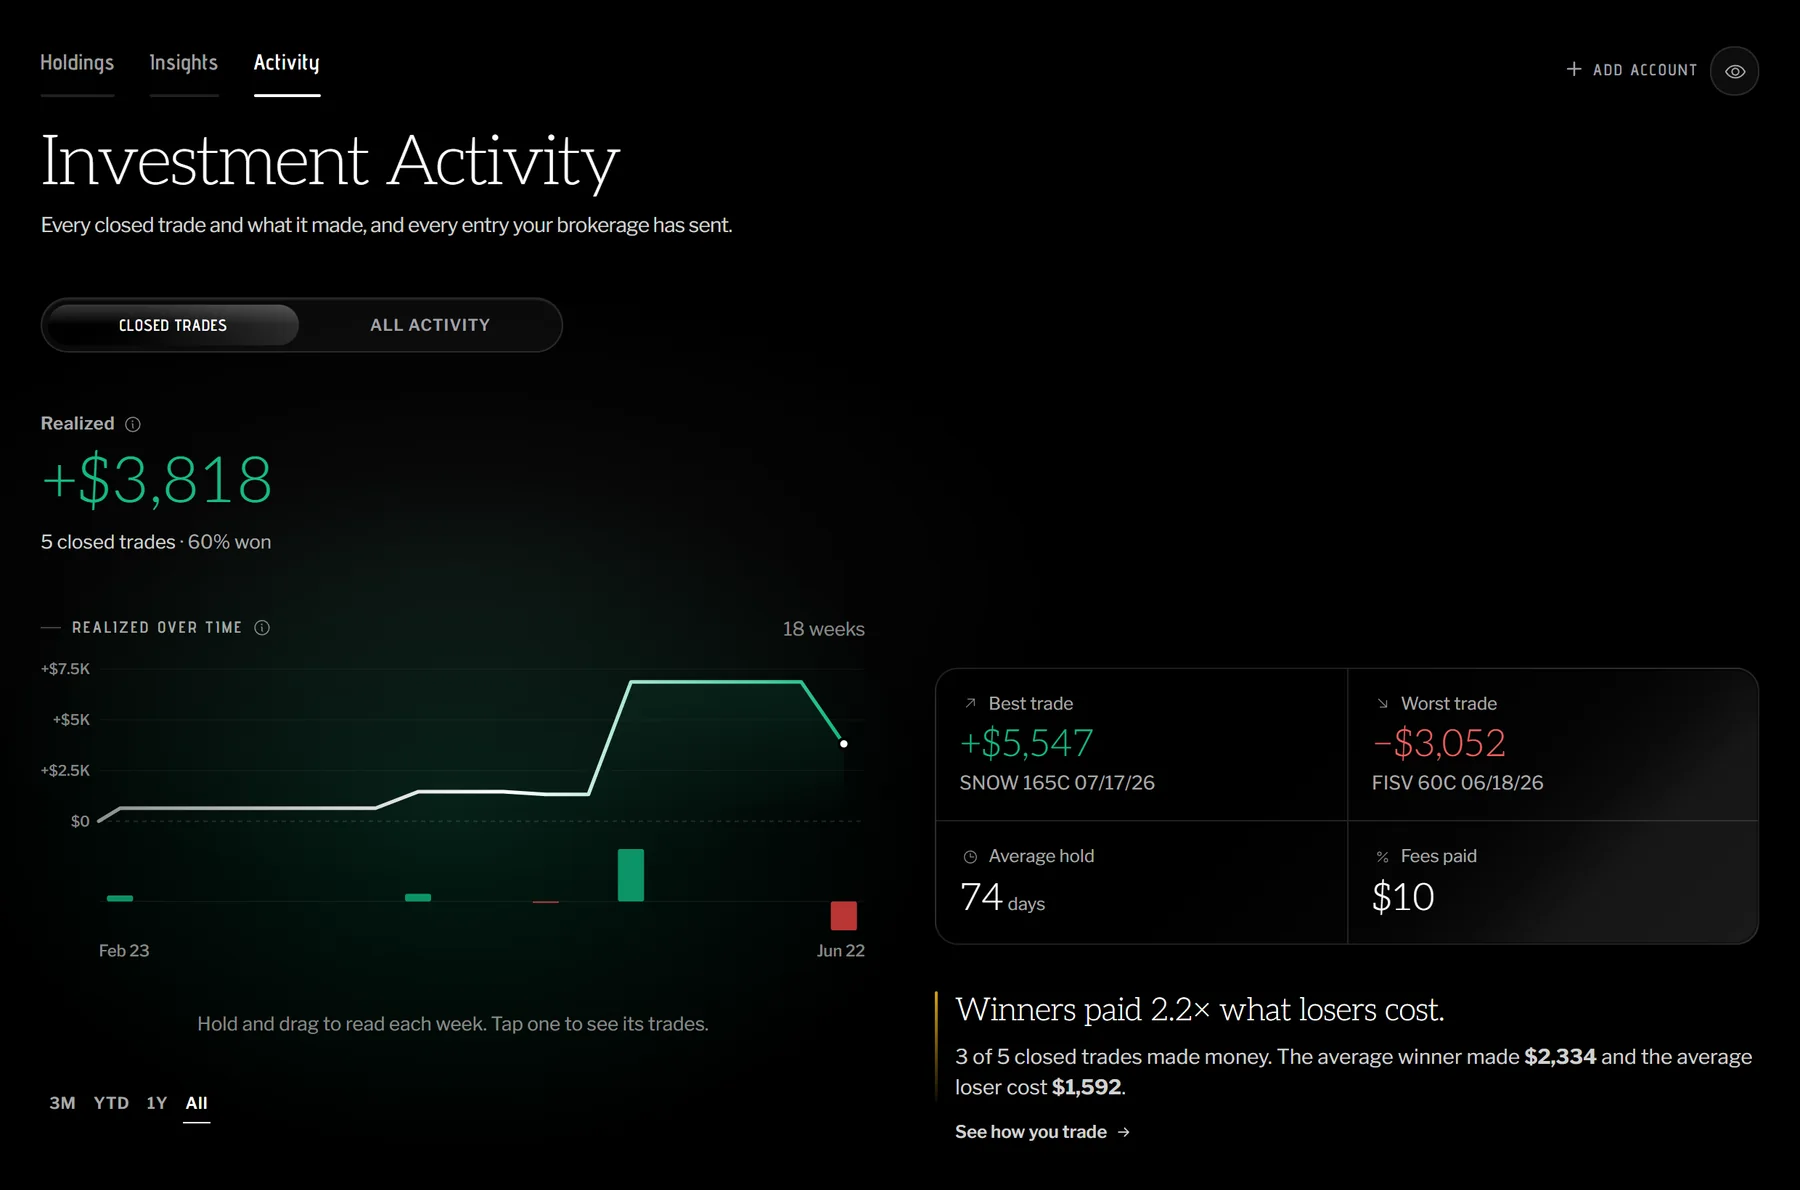
Every closed trade, and what it made.
Activity keeps the realized gain or loss on every position you close across your linked brokerages, matched first in, first out from the activity each brokerage sends. It charts the total over time and names your best and worst trades, your average hold and the fees you paid.
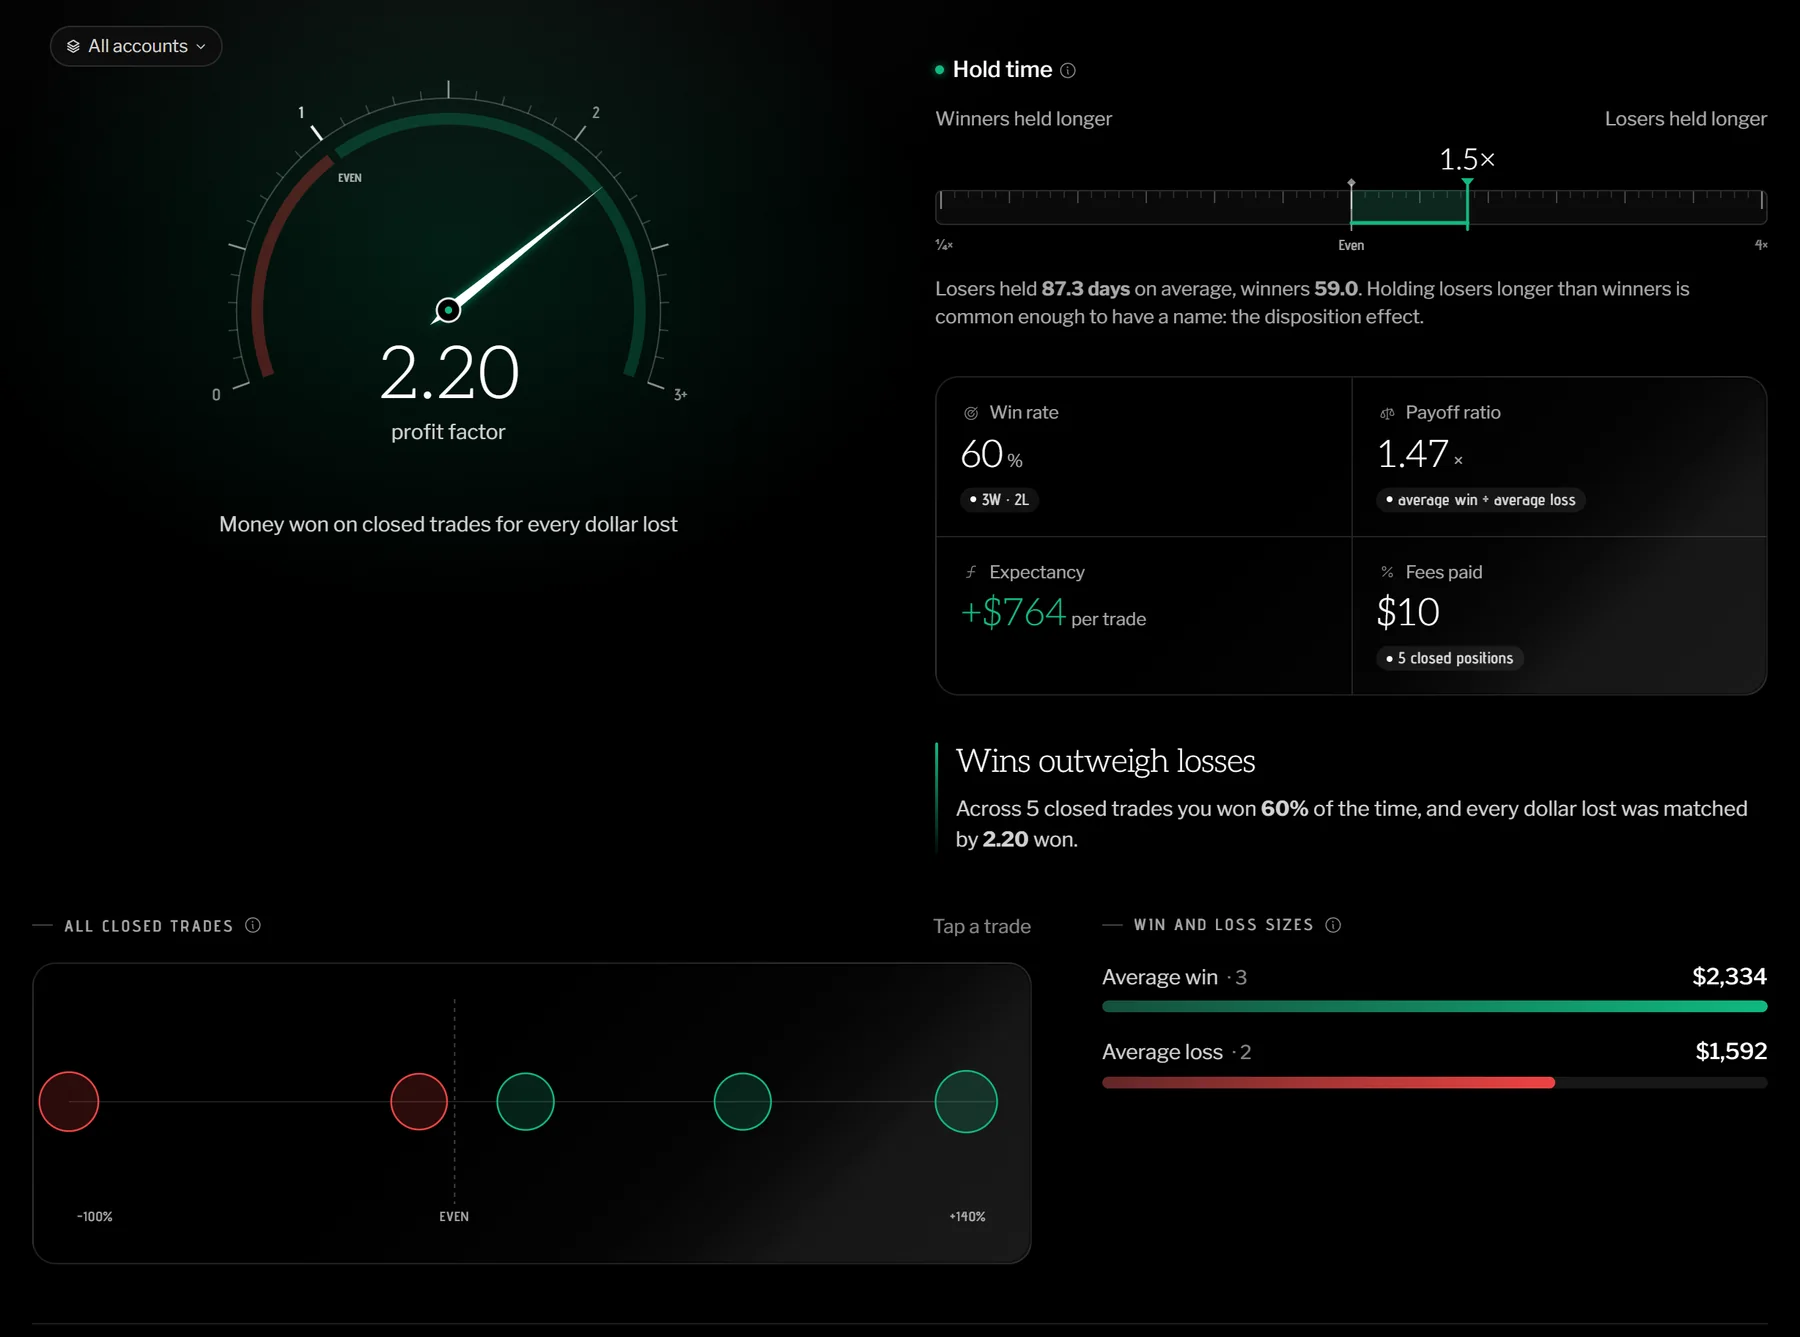
How you trade, in numbers.
The Behavior lens reads the same closed trades: the profit factor, money won for every dollar lost, your win rate, the payoff ratio and the expectancy per trade, and whether you hold losers longer than winners.
What it does not do
- It is not a tax form. Your brokerage's 1099-B is the record for your return, and it can differ: a brokerage may sell specific lots, and it reports wash-sale adjustments, which these figures do not make.
- Lots and purchase dates are the ones your brokerage reports. Where it reports none, the app says so.
- It never sells anything. Connections are read-only.
- Nothing here is tax advice.
Tax lots and realized gains are on Pro, $4.99 a month, or on Nexus. Brokerages link read-only through SnapTrade. Compare the plans
Common questions
Is the realized gain the same as my 1099-B?
Not always. Net Worth Nexus matches buys and sells first in, first out from the activity your brokerage sends, while your brokerage may have sold specific lots and reports wash-sale adjustments, which Net Worth Nexus does not make. The 1099-B from your brokerage is the record for your tax return.
What if my brokerage doesn't report purchase dates?
Then holding periods cannot be measured, and the Tax lens says so. The lot map places positions by size instead.
Which plan includes it?
Pro, at $4.99 a month, or Nexus at $9.99.
The real interface, on sample data.
Every screen on this page is in the demo. No account, no card, no email.
